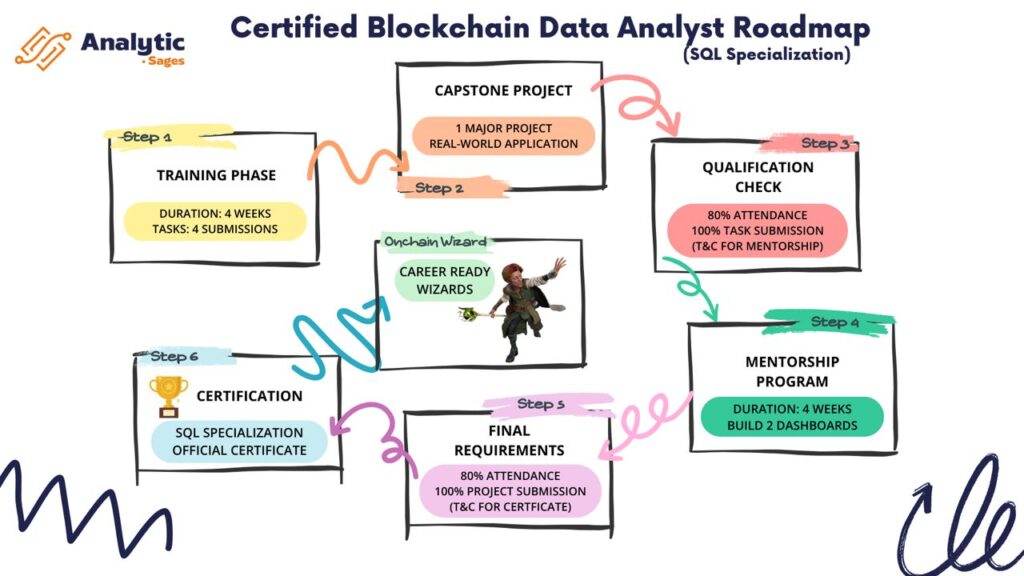
Module 1: Introduction to Web3 Data Analytics
Session Highlights:
- Understanding Blockchain Data: Learn what blockchain data is and why it’s critical to decentralized systems.
- Why On-chain Data Matters: Discover key use cases (e.g., DeFi monitoring, wallet tracking, fraud detection).
- Overview of Blockchain Data Tools: Introduction to tools like Etherscan, Dune Analytics and their roles.
- Exploring Blockchain Explorers: Practical sessions navigating Etherscan and Blockchain.com for transactions, token flows, and contract interactions.
Project:
Write a comprehensive guide on using Etherscan to:
- Analyse wallet transactions
- Explore smart contract details
- Track token transfers and activities
Module 2: SQL for Web3 Data Analytics
Session Highlights:
- SQL Foundations in Web3: Learn SQL basics (SELECT, WHERE, ORDER BY) with blockchain-specific examples.
- Joins and Aggregations: Use JOINs to combine wallet, transaction, and token data; apply COUNT, SUM, AVG to get insights.
- Subqueries and CTEs: Understand nested queries and Common Table Expressions for complex analytics (e.g., top traders, protocol usage).
️ Practice Examples:
- Query wallet balances and transaction history.
- Identify active users on a DeFi protocol.
- Aggregate token swap volumes over time.
Module 3: Working with Blockchain Data
Session Highlights:
- Advanced On-chain Tools: Hands-on sessions using Dune Analytics to write SQL queries directly on live blockchain datasets.
- Understanding Blockchain Data Tables: Learn the schema and structure of on-chain datasets—blocks, logs, events, traces.
- Analyzing Smart Contracts & DEXs: Track Uniswap activity: liquidity, volume, swap counts, top trading pairs.
 Project:
Build a SQL-based dashboard analyzing Uniswap:
- Daily/weekly/monthly volume
- Liquidity pool size and participants
- Unique user interactions over time
Module 4: Building Insightful Dashboards
Session Highlights:
- Token Performance Dashboard: Track token price, holder distribution, and transaction trends using SQL outputs and visualization tools (e.g., Dune Dashboards or Tableau).
- Data Visualization Best Practices: Learn to tell stories from data—choosing the right charts, layout, and filtering tools for user experience.
- Capstone Project: End-to-end project to demonstrate skills gained.
Capstone Project:
Design a full dashboard for a token or protocol of your choice:
- Include price trend, wallet interaction, and gas fee metrics
- Showcase user retention or protocol growth over time
Present the dashboard with actionable insights for the community
Registration Deadline: 30th April, 2026
Program Starts: 4th May, 2026